如何配置grafana来监控windows设备
1、使用命令 vim /usr/local/prometheus/prometheus.yml 编辑prometheus的配置文件

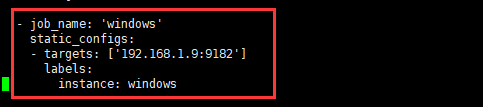
2、在配置文件中增加windows的配置,保存退出
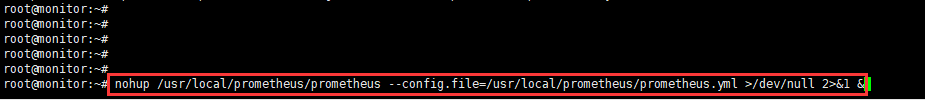
3、执行命令nohup /usr/local/prometheus/prometheus --config.file=/usr/local/prometheus/prometheus.yml >/dev/null 2>&1 &启动prometheus服务
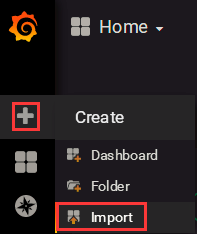
4、登录grafana后,点击左侧的加号图标,再点击Import
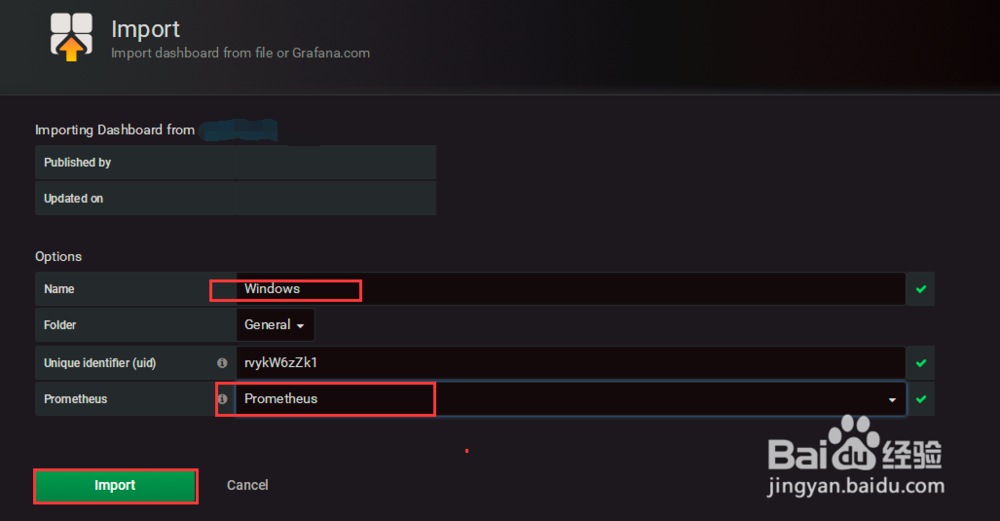
5、在Import界面,点击Upload .json file按钮导入windows监控模板

6、选择数据源为Prometheus,点击Import按钮
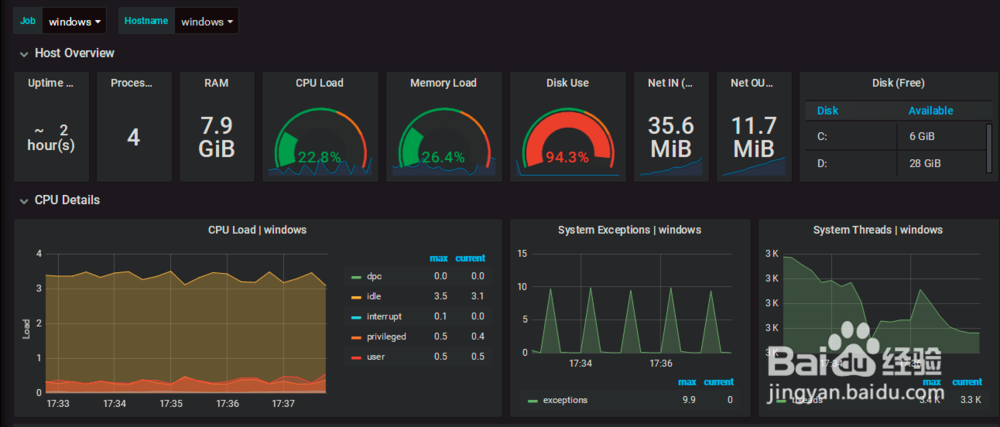
7、能够看到系统的监控界面,说明配置成功了,可以监控windows主机的资源使用情况了。到此配置prometheus监控windows设备的方法就介绍完了。
1、使用命令 vim /usr/local/prometheus/prometheus.yml 编辑prometheus的配置文件
2、在配置文件中增加windows的配置,保存退出
3、执行命令nohup /usr/local/prometheus/prometheus --config.file=/usr/local/prometheus/prometheus.yml >/dev/null 2>&1 &启动prometheus服务
4、登录grafana后,点击左侧的加号图标,再点击Import
5、在Import界面,点击Upload .json file按钮导入windows监控模板
6、选择数据源为Prometheus,点击Import按钮
7、能够看到系统的监控界面,说明配置成功了,可以监控windows主机的资源使用情况了。到此配置prometheus监控windows设备的方法就介绍完了。