Matlab中使用plot作图
1、首先我们生成两列数,暂时取名为aa。
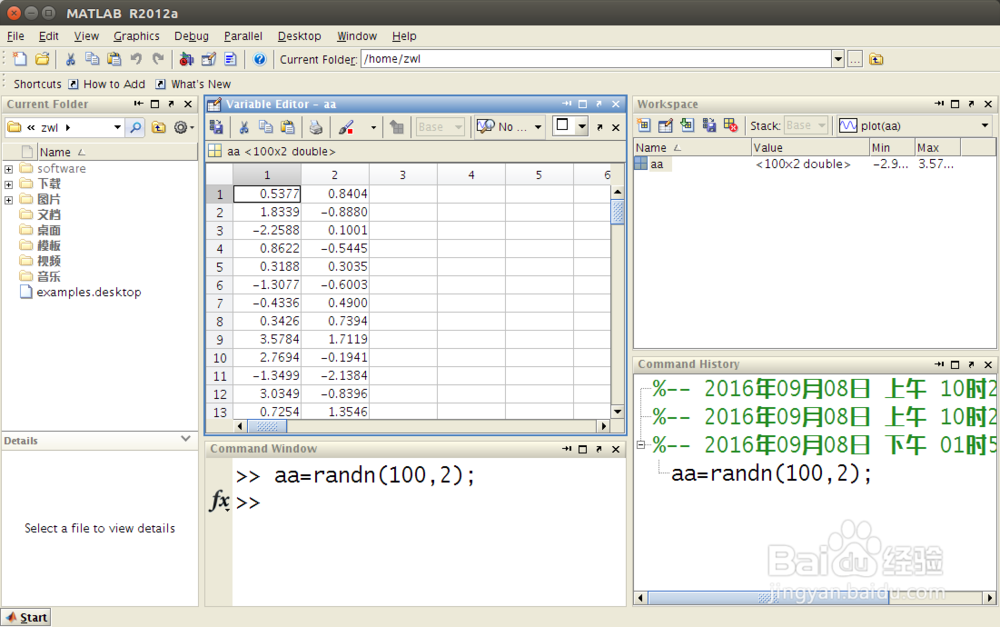
2、在matlab命令行输入:
plot(1:100,aa(:,1));
这是最常用的plot命令,可以得到如下图像。

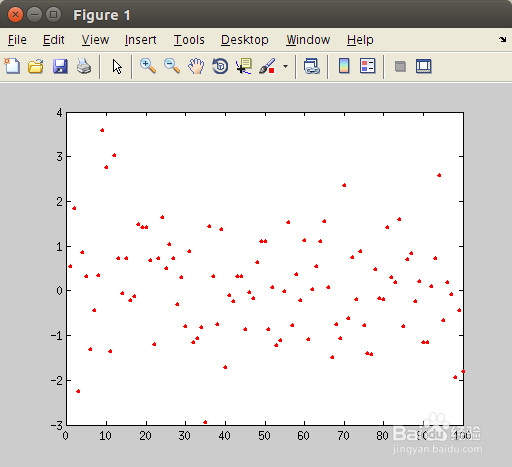
3、在plot括号中还有许多可以添加的内容:
plot(1:100,aa(:,1),'r.');
得到的是红色的点状图。
r表示红色,另外还有g(绿色),k(黑色),y(黄色)等。
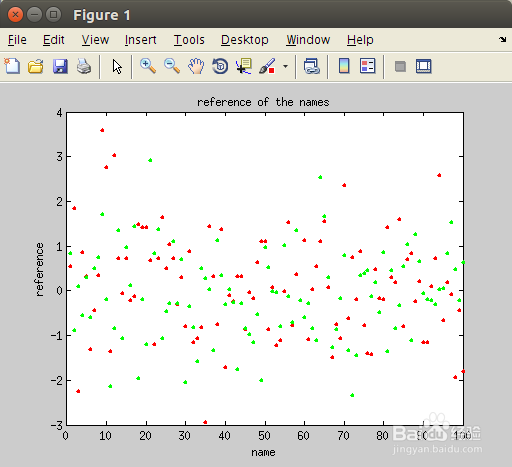
4、图形完成后,还可以做修饰,xy坐标的内容:
xlabel('name');
ylabel('reference');

5、加入图名:
title('reference of the names');

6、还可以加入其他数据:
hold on;
plot(1:100,aa(:,2),'g.');
7、在图上加图例:
legend('red','green','location','southwest');
matlab中location表示位置,后面southwest表示图上的实际位置,上北下南左西右东。

8、加入网格:
grid on;

阅读量:54
阅读量:49
阅读量:141
阅读量:100
阅读量:60